728x90
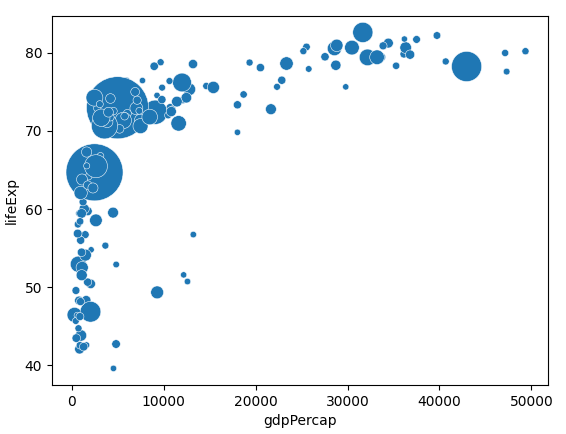
버블 차트는 크게 산점도와 비슷하나 원의 크기로 변수의 크기를 나타낼 수 있는 차트이다.
import matplotlib.pyplot as plt
import seaborn as sns
from gapminder import gapminder

if __name__ == '__main__':
    data = gapminder.loc[gapminder['year'] == 2007]
print(data.head())
    sns.scatterplot(data=data, x='gdpPercap', y='lifeExp', size='pop', legend=False, sizes=(20, 2000))
    plt.show()


결과 값
        country continent  year  lifeExp       pop     gdpPercap
11  Afghanistan      Asia  2007   43.828  31889923    974.580338
23      Albania    Europe  2007   76.423   3600523   5937.029526
35      Algeria    Africa  2007   72.301  33333216   6223.367465
47       Angola    Africa  2007   42.731  12420476   4797.231267
59    Argentina  Americas  2007   75.320  40301927  12779.379640
728x90
'Data Science > Data Visualization' 카테고리의 다른 글
| [05. Etcetera Chart] 006. Funnel Plot (0) | 2021.10.06 |
|---|---|
| [05. Etcetera Chart] 005. Rader Chart (0) | 2021.09.06 |
| [05. Etcetera Chart] 003. Histogram (0) | 2021.09.06 |
| [05. Etcetera Chart] 002. Scatter Plot (0) | 2021.09.06 |
| [05. Etcetera Chart] 001. Box Plot (0) | 2021.09.06 |


